高中信息技术:
高中 信息技术
-
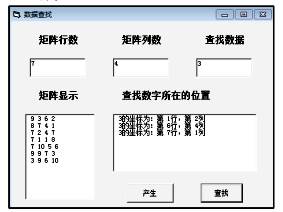
(1) 实现上述功能的VB程序如下,请在划线处填入合适的代码。
Dim a(1 To 100) As Integer
Dim m As Integer, n As Integer
Private Sub Command1_Click()
Dim i As Integer, j As Integer, x As Integer
Dim s As String
m = Val(Text1.Text)
n = Val(Text2.Text)
Randomize
For i = 1 To m
For j = 1 To n
x = Int(Rnd * 10 + 1)
Next j
Next i
s = ""
For i = 1 To m * n
s = s + Str(a(i))
If i Mod n = 0 Then
List1.AddItem s
End If
Next i
End Sub
Private Sub Command2_Click()
Dim i As Integer, x As Integer, y As Integer
Dim key As Integer, flag As Boolean
key = Val(Text3.Text): flag = False
For i = 1 To m * n
If key = a(i) Then
x = (i - 1) \ n + 1
y =
list2.AddItem Str(key) + "的坐标为:第" + Str(x) + "行,第" + Str(y) + "列"
flag = True
End If
Next i
If Not flag Then
list2.AddItem "未查找到相应数据!"
End If
End Sub
-
(2) 若随机产生矩阵
 ,查找数据为3,则在列表框List2中显示内容是。
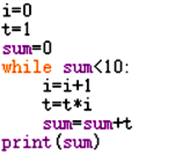
s="D5u6p@1_2t3B" num=0
for i in s[::-1]:
if "a"<=i<="z" or "A"<=i<="Z" or "0"<=i<="9":
if "0"<=i<="9":
num=num*10+int(i)
else:
break print(num)
该部分程序段运行后,变量 num 的值是( )
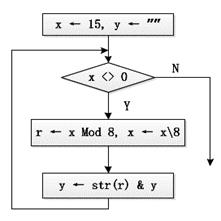
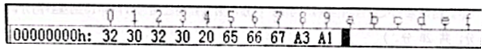
运行输出结果是:
![]()
 图a
图a
 图b
图b
-
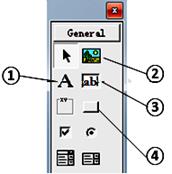
(1) 结合程序功能,在设计程序界面时,应使用图b所示“控件工具箱”中的 (填写相应编号)添加该程序的“输出”对象。
-
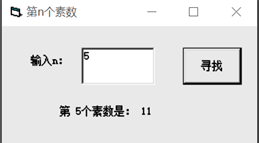
(2) 实现上述功能的VB程序如下,请在划线处填写合适的代码。
Private Sub Command1_Click()
Dim n As Integer, i As Integer, s As Integer, x As Integer, f As Boolean
n = Val(Text1.Text)
f = False: s = 0
i = 2
Do While f = False
x = 2
Do While x <= Int(Sqr(i)) And i Mod x <> 0
①
Loop
If x > Int(Sqr(i)) Then
s = s + 1
If ② Then
Label2.Caption = "第" & Str(n) & "个素数是:" & Str(i)
f = True
End If
End If
i = i + 1
Loop
End Sub
① ② -
(3) 若在text1中输入n为3,则单击“寻找”按钮后,label2中输出的是。
-
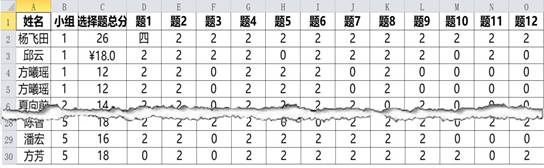
(1) 观察上表小明做了如下操作,其中属于数据整理的是 (多选,填字母)A . 删除重复行第五行 B . 验证并修改D2单元格数据 C . 通过公式计算全班平均分 D . 重新设置C3单元格格式
-
(2) 为了分析每个组的平均分,设计了如下Python程序。
import pandas as pd
import matplotlib.pyplot as plt
df=pd.read_excel("成绩表.xlsx")
print(df1)
划线处的代码应为 (单选,填字母)
A . df1=df.groupby("平均分").mean() B . df1=df.mean() C . df1=df.groupby("小组").mean() D . df1=df["小组"].mean() -
(3) 利用Python程序绘制各小题得分率图表,如图所示:

请在划线处填写合适的代码。
num=int(input("请输入小组:"))
plt.figure(figsize=(10,5))
list=[]
for i in range(12):
s="题"+str(i+1)
list.append(df1.at[num,s]*50)
plt.bar(range(1,13),list)
plt.title(str(num)+" ")
plt.xlabel("question number")
plt.ylabel("correct rate")
plt.show()
- 将两份等质量的木炭,一份与足量的氧气完全反应生成二氧化碳M g,另一份先与不足量的氧气反应生成一氧化碳,然后再使其完全燃
- 现有一圆心角为90°,半径为8cm的扇形纸片,用它恰好围成一个圆锥的侧面,则该圆锥底面圆的半径为( )
- 下列句后括号里与加点的词语不能替换的一项是 A 俗话说得好“ 近朱者赤,近墨者黑”,这位公安厅长就是因为结交了些不三不四
- 今天的午餐食谱是:主食——面包;配菜和副食——炸鸡腿、炸薯片、牛排、牛奶。则该午餐食谱缺乏的营养素是 学科王 A.糖类
- 阅读下面的唐诗,回答问题。 登润州城 丘为 天末江城晚,登临客望迷。 春潮平岛屿,残雨隔虹蜺。 鸟与孤帆远,烟和独树低。
- 以下是净水的操作,单一操作相对净化程度由低到高的排列顺序正确的是() ①静置沉淀 ②过滤 ③吸附沉淀
- 2006年7月28日上午,江苏省射阳县氟源化工有限公司在调试生产2,4-二氯氟苯时,氯化和硝化两车间反应釜突然发生爆炸,
- 某无色溶液中加入BaCl2溶液,生成不溶于稀硝酸的白色沉淀,则溶液中含有的离子是( ) A.一定有 CO32-
- 下列除去杂质(少量)的方法中,不正确的是()选项 物质 杂质 除杂方法 A CO CO2 通入足量的氢氧化钠溶液、干燥
- 表现型正常的双亲生有一色盲的孩子,其体细胞性染色体组成是XXY,这是由于双亲之一在形成配子时出现了罕见的性染色体不分离现
- 最近,我国科学家采用铝釙埋藏测量法的技术测定,北京猿人生活在约70万年前,此前根据其它测年法,学术界采信“四五十万年前的
- 如图10-1-7所示,不计电阻的U形导轨水平放置,导轨宽l=0.5 m,左端连接电源(电动势E=6 V、内阻r=0.9
- 在下列各溶液中,微粒的物质的量浓度关系一定正确的是 A.NaHCO3溶液中:c(OH-)+c(HCO3-)
- 正方形金属线框abcd,每边长=0.1m,总质量m=0.1kg,回路总电阻Ω,用细线吊住,线的另一端跨过两个定滑轮,挂着
- 下列化肥中,属于复合肥料的是() A.CO(NH2)2B.KNO3C.K2SO4D.Ca3(PO4)2
- (10分)上海世博会期间,某商店出售一种海宝毛绒玩具,每件获利60元,一天可售出20件,经市场调查发现每降价1元可多售出
- 有甲、乙、丙、丁4盆长势均匀的植物置于阳光下,甲添加品红色光;乙添加绿色光;丙添加品红色滤光片A;丁添加绿色滤光片B(如
- 4位同学参加某种形式的竞赛,竞赛规则规定:每位同学必须从甲、乙两道题中任选一题作答,选甲题答对得100分,答错得-100
- 某校从8名教师中选派4名教师同时去4个边远地区支教(每地1人),其中甲和乙不同去,甲和丙只能同去或同不去,则不同的选派方
- 郑板桥有诗云:“新竹高于旧竹枝,全凭老干为扶持。明年再有新生者,十丈龙孙绕风池。”其中的哲学寓意是①新事物具有强大的生


