4.2 数值计算 知识点题库
while True:
for event in pygame.event.get(): #()
if event.type==pygame.QUIT: #( )
sys.exit() #退出程序
if event.type==pygame.MOUSEBUTTONDOWN: #( )
screen.fill((255,255,0)) #窗口填充黄色*
#加载背景图像
#将背景图画在窗口
pygame.display.update() #窗口刷新
import pandas as pd
s1 = pd.Series(range(1,10,2))
print(s1)
该程序段运行后输出结果为( )
 B .
B .  C .
C . 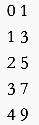 D .
D . 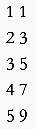
import pandas as pd
df1=pd. DataFrame([[10, 20], [30, 40]], columns=['A','B'])
df2=pd. DataFrame([50, 60], [70, 80]], columns=['A',B'])
df=df1. append(df2,ignore_ index= True)
print(df)
该程序段运行后输出结果为( )
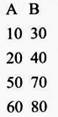 B .
B . 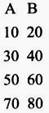 C .
C . 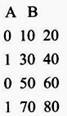 D .
D . 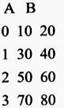
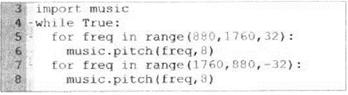
代码中“import music”表示导人music模块,它包含了生成和控制声音的方法,music.pitch(freq,8)表示播放设定频率的曲调,时间为8ns。下载并运行该代码,在蜂鸣器中听到的声音效果是( )
#数据库中获取数据存储在列表中
import json #导入json函数库
① #导入SQLite函数库
conn = sqlite3.connect("test.db")
json_ info=[] #变量json_info存储记录数据
cur = conn.cursor( )
sql= "select * fromstd ② " #查询ssex字段值为“man”的所有记录
cur.execute(sql)
json_ info = cur.fetchal( ) #将符合记录数据保存到变量json_info
conn.commit( )
cur.close( )
conn.close( )
#将记录转换为json格式的数据
file = open('b.json', 'w', encoding-'utf-8') #打开json格式文件
json.dump( ③ , file) #将变量json_info转换为json格式保存到文件中
file.close( )
请回答下列问题:
-
(1) 当前使用的数据库文件名称是,访问的数据表名为 。
-
(2) 转换为JSON格式的数据后存储的文件名是。
-
(3) 结合实现上述功能的Python程序,请在划线处填入合适的代码。
① ② ③
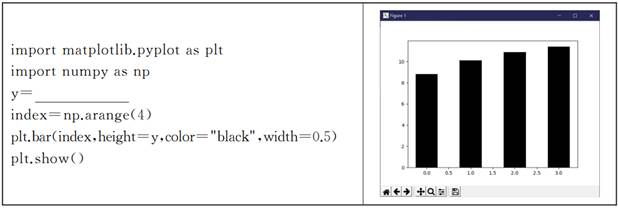
-
(1) 先要解决的问题是把全班50名同学的姓名输入到一个列表s中,以下能解决该问题的程序段是( )A . s=""
s=input("请输入一个姓名并回车")*50
B . s=[]for x in range(50):
s=s+[input('请输入一个姓名并回车')]
C . s=""for x in range(50):
s+=input("请输入一个姓名并回车")
D . for x in range(50):s=[]
s=s+[input('请输入一个姓名并回车')]
-
(2) 名单输入后,下面解决抽名字的问题了,下列程序段能解决自动随机抽取一位同学姓名的是( )
①import random
print(random.choice(s))
②import random
n=random.randint(0,49)
print(s[n])
③import random
for n in range(50):
print(s[n])
④import random
n=int(input("请输入0-49间任意整数:"))
print(s[n])
A . ①② B . ①③ C . ②④ D . ③④
程序描述:2公里(包括2公里)内,起步价为5元,超过2公里部分(不足整公里的,向上取整),每公里1.6元。
代码如下:
Import ① #引用math库
s= ② (input("请输入你要去目的地距离出发点的公里数:))
If ③ : #2公里(包括2公里)内
cost =5
else:
cost = 5+math.ceil(s-2) *1.6
print("你的打的费用是", cost,“元)
①处的语句是,②处的语句是,③处的语句是
①A.math B.Numpy C.time D.Matplotlib
②A.Float B.Int C.str D.Math
③A.s≤2 B.s<=2 C.s>2 D.s≥2
|
图1 |
图2 |
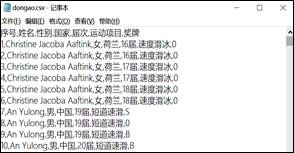
为分析数据,小张编写了如下程序:
import pandas as pd
import matplotlib.pyplot as plt
from matplotlib.pyplot import MultipleLocator
plt.rcParams['font.sans-serif']=['SimHei'] #正常显示中文标签
df=pd.read_csv("dongao.csv")
#删除所有未获得奖牌的记录,并将奖牌列中的"G"修改为"金牌","S"修改为"银牌","B"修改为"铜牌"
jp={'G':'金牌','S':'银牌','B':'铜牌'}
for i in df.index:
if ① :
df=df.drop(i)
else:
df.at[i,'奖牌']=jp[df.at[i,'奖牌']]
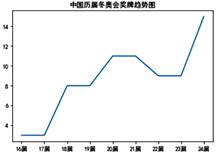
#对输入国家每届的奖牌数进行统计,并制作相应图表,如第14题图2所示:
nt=input("请输入国家名称:")
df1=df[df['国家']==nt]

df3=pd.DataFrame(df2) #将分组后数据生成新的二维结构,索引为“届次”,列标题为“奖牌”
x=df3.index
y= ②
plt.title(nt+"历年冬奥会奖牌趋势图")
plt. ③ (x,y)
plt.show()
-
(1) 在划线处填上合适的代码。
①②③ -
(2) 为了最后能显示某国历届冬奥会奖牌变化,需在加框处添加的语句为( )(多选)A . df2=df1.groupby('奖牌')
df2=df1.届次.count()
B . df2=df1.groupby('届次')df2=df2['奖牌'].count()
C . df2=df1.groupby('奖牌')['届次’].count() D . df2=df1.groupby('届次').奖牌.count()
from random import randint
a=[0]*6
for i in range(6):
a[i]=randint(1, 10)
for i in range(6):
if a[i]%2==0 and i%2== 0:
a[i] += 1
elif i%2==1:
a[i]=a[i]+a[i- 1]
print(a)
程序运行后,输出结果可能是 ( )
- (12分)某同学利用图甲所示的电路测量一定值电阻Rx的阻值。所用的器材有: 待测电阻Rx,阻值约为50Ω 电流表A1,内
- “‘嫦娥一号’研发团队用短短三年多时间攻克了一系列技术难题,拿下了一大批具有自主知识产权的核心技术,使中国人更加深入地认
- 设,则p是q成立的 (A)充分不必要条件 (B)必要不充分条件 (C)充分必要条件 (D)既不充分也不必要条件
- 设NA表示阿伏加德罗常数的值,下列说法中正确的是( ) A.常温常压下,32 g O2
- But for the party, he ___ of hunger 30 years ago. A. would
- 9.将黑斑蛇与黄斑蛇杂交,子一代中既有黑斑蛇,又有黄斑蛇;若再将F1黑斑蛇之间交配,F2中既有黑斑蛇又有黄斑蛇。由此分析
- 就海陆分布而言,我国属于( ) A.内陆国 B.半岛国家 C.海陆兼备之
- 图中洋流对相邻陆地环境的影响是 A.增加了湿、热程度
- 为了探究声音的响度与振幅的关系,小明设计了如图所示的几个实验。你认为能够完成这个探究目的的是( )
- 在一定条件下,将钠与氧气反应的生成物1.5 g溶于水,所得溶液恰好能被80 mL浓度为0.50 mol/L的HCl溶液中
- 现有以下物质:①NaCl溶液;②干冰;③冰醋酸(纯净的醋酸);④铜;⑤BaSO4固体;⑥蔗糖;⑦酒精;⑧熔融的KNO3其
- 图是某人在饭前、饭后血糖含量的变化曲线。引起图中d~e段血糖浓度下降的激素是 A.甲状腺激素 B.胰岛素
- 读“我国承转全球IT产业转移的路径” (图A)和“IT全球化竞争的金字塔模型示意图” (图B),完成25~2
- 下面示例是为课文《药》中的人物驼背五少爷配的一首小诗.请从我们高中所学的课文中另选一个人物也写一首小诗。语言形式不拘于所
- 10.补写出下列名篇名句中的空缺部分。(6分) ⑴1.诸葛亮在《出师表》一文中,表明自己无意功名,淡泊名利的句子是 “
- 下列有关细胞器的叙述,正确的是( ) A.进行厌氧呼吸的细胞中没有线粒体 B.在动物细胞有丝分裂的后期,着丝粒的分
- To prevent Internet crimes, itis important to make new laws
- 读图,完成问题。图中b代表的季节出现时,下列城市的昼长最长的是
- 在下列各式中,的同类二次根式是 A. B. C.
- 在马克思主义哲学产生以前,即便是在自然观上相当坚定的唯物主义者,一旦进入社会领域,总是不可避免地陷入唯心主义;而马克思主


